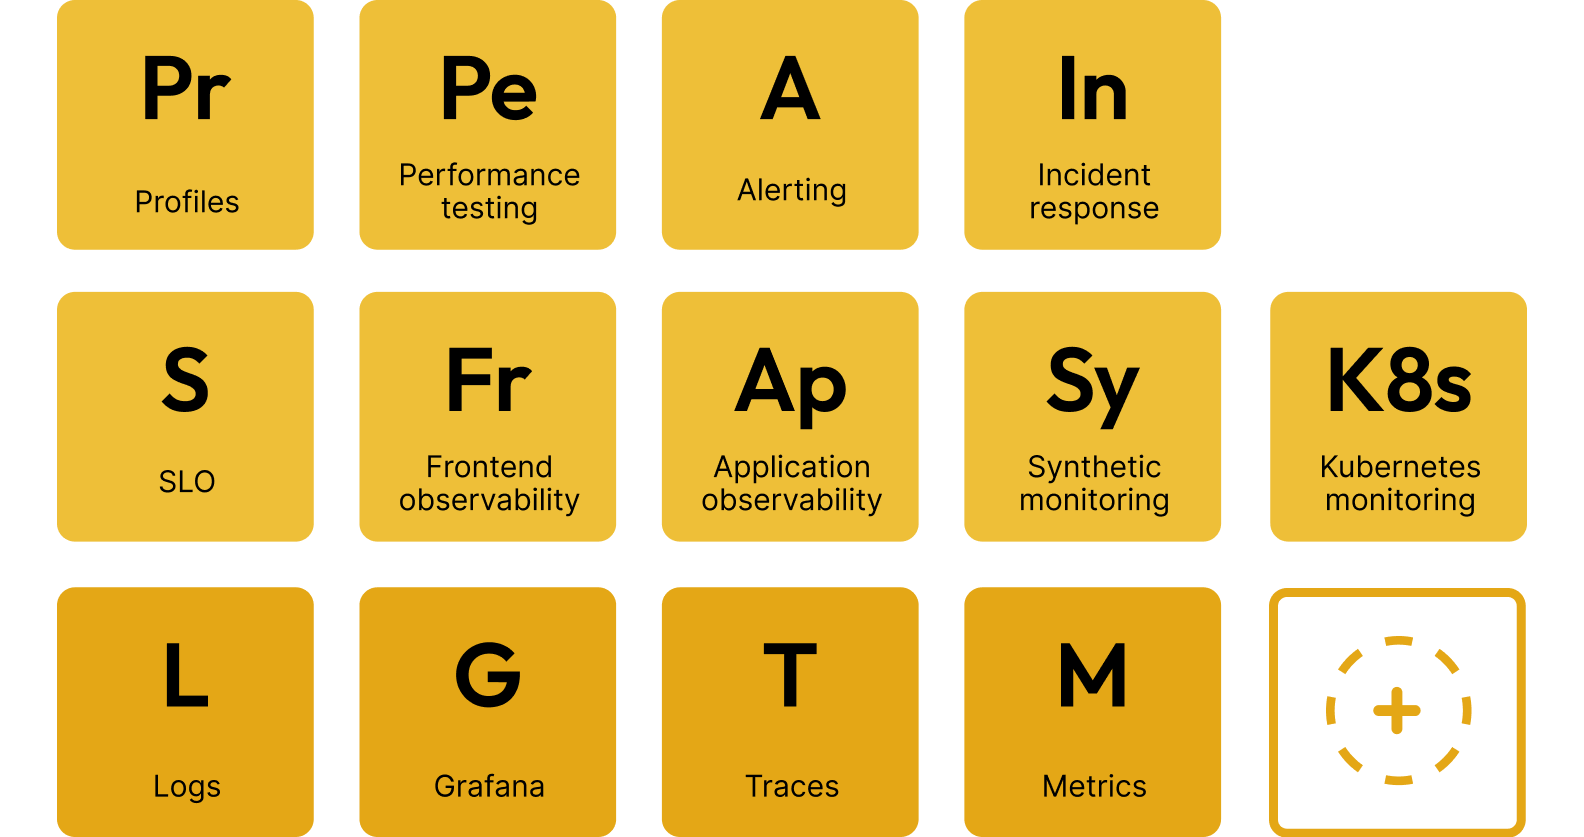
Periodic table of observability

Your tools / data
Query /
keep data where it is

diagram dots
Send data to backends
Open standards: OTel, Prometheus
Testing
Observability solutions
Incident response management
Key capabilities
Building blocks: telemetry databases (LGTM+)
No lock-in
Open standards: OTel, Prometheus
Play around with the Grafana Stack
Experience Grafana for yourself, no registration or installation needed.

Grafana showcase
Watch0:14
A problem with video playback occurred. If it persists, please email <a href="mailto:update@grafana.com">update@grafana.com</a> for help.
Upcoming and recent events
StarWest: Ramping Up Modern Performance & Performance Assurance and SRE
Nerdearla Buenos Aires
Grafana & Friends Kuala Lumpur - Grafana & Friends Kuala Lumpur - September 2024
All upcoming events On-demand webinars and videos
Grafana Labs Blog
News, announcements, articles, metrics & monitoring love